
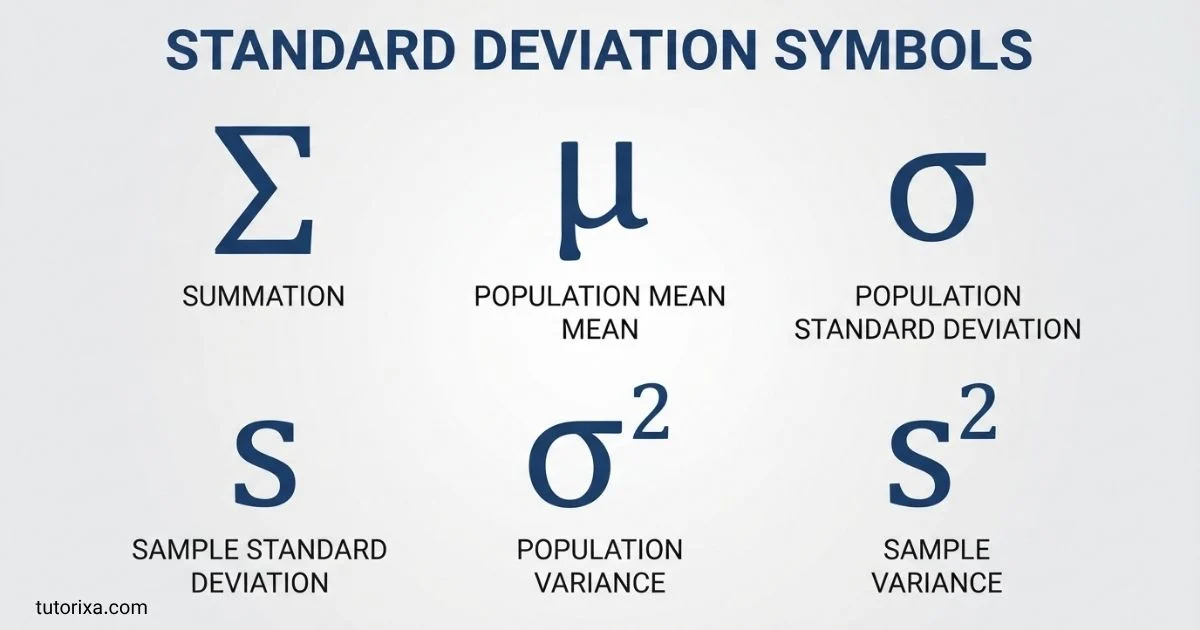
Standard deviation can look confusing when you first see symbols like σ, s, μ, and x̄ in a statistics formula. I know these symbols can feel overwhelming, but once you understand what each one represents, the topic becomes much easier.
You don’t need to memorize every formula to understand standard deviation symbols. I’ll break down the most important notation in simple language so you can quickly see what each symbol means and when it is used.
Whether you’re a student, beginner, or simply reviewing statistics, you’ll find practical explanations here. By the end, you’ll be able to recognize common standard deviation symbols and understand how they relate to samples, populations, means, and data spread.
Quick Meaning of Standard Deviation Symbols
The standard deviation symbols σ and s represent measures of data spread. σ usually denotes the standard deviation of an entire population, while s usually denotes the standard deviation calculated from a sample. Related notation includes σ² for population variance, s² for sample variance, μ for the population mean, x̄ for the sample mean, and Σ for summation.
Standard Deviation Symbol Overview
| Symbol | Name | Primary Meaning | Common Use |
| σ | Lowercase sigma | Population standard deviation | Describing the spread of an entire population |
| s | Lowercase s | Sample standard deviation | Estimating population spread from a sample |
| σ² | Sigma squared | Population variance | Square of the population standard deviation |
| s² | s squared | Sample variance | Square of the sample standard deviation |
| μ | Mu | Population mean | Average of an entire population |
| x̄ | x-bar | Sample mean | Average of a sample |
| Σ | Capital sigma | Summation | Indicates that values should be added |
| n | Lowercase n | Sample size | Number of observations in a sample |
| N | Uppercase N | Population size | Number of observations in a population |
| xᵢ | x-sub-i | Individual observation | Represents one data value |
| σ̂ | Sigma-hat | Estimated population parameter | Used in some statistical contexts for an estimate of σ |
The exact notation can vary by textbook, field, or statistical convention. NIST documentation, for example, identifies σ as population standard deviation and s as an estimate based on sample data.
What Does the Standard Deviation Symbol Mean?
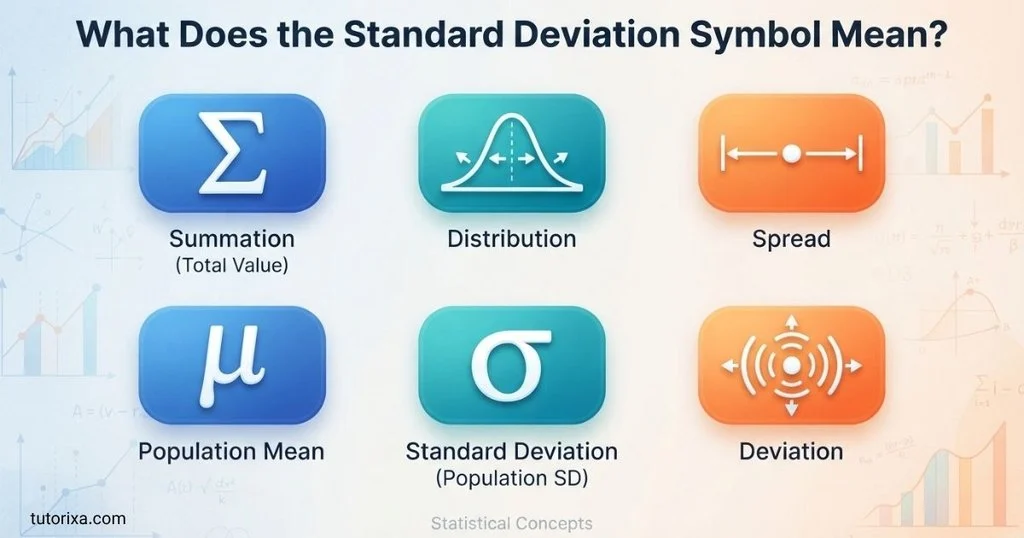
The standard deviation symbol tells you how dispersed a set of numerical values is around its mean.
A small standard deviation means the observations tend to remain relatively close to the mean. A larger standard deviation means the observations are more widely dispersed.
For a population, the standard deviation is commonly written as:
σ = √[Σ(xᵢ − μ)² / N]
For a sample, the commonly used formula is:
s = √[Σ(xᵢ − x̄)² / (n − 1)]
The distinction matters because a sample is generally being used to estimate characteristics of a larger population. NIST describes the sample standard deviation using the n − 1 denominator.
What Does σ Mean?
σ is the lowercase Greek letter sigma. In statistics, it commonly represents the population standard deviation.
For example, if a researcher has data for every member of the population being studied, the population standard deviation may be represented by σ.
The symbol is not itself a measurement. It is a notation convention that tells the reader which statistical quantity is being discussed.
What Does s Mean?
s commonly represents the sample standard deviation.
Suppose a researcher wants to study the test scores of every student in a large school district but collects scores from only 100 students. The calculated spread from those 100 observations can be represented by s.
That sample statistic is used to estimate the population’s standard deviation, σ. NIST explicitly distinguishes population parameters such as σ from sample estimates such as s.
What Does σ² Mean?
σ² represents the population variance.
Variance is the square of standard deviation:
Variance = (Standard deviation)²
Therefore:
σ² = variance of the population
Because standard deviation is the square root of variance:
σ = √σ²
NIST describes variance as the square of the standard deviation and notes that standard deviation is expressed in the same units as the measured quantity, while variance is expressed in squared units.
What Does s² Mean?
s² commonly represents the sample variance.
It is calculated from sample observations and is related to the sample standard deviation by:
s² = (s)²
Conversely:
s = √s²
This distinction is useful when reading statistical formulas because variance and standard deviation describe the same underlying dispersion in different mathematical forms.
History and Origin of Standard Deviation Symbols
The modern standard deviation notation has roots in the development of mathematical statistics during the late nineteenth century.
Karl Pearson and the Term “Standard Deviation”
Karl Pearson is generally credited with introducing the term standard deviation in his statistical work. Historical sources report that Pearson used the term in a lecture on January 31, 1893, and the symbol σ for standard deviation appears in his 1894 paper Contributions to the Mathematical Theory of Evolution.
Before this terminology became established, related measures were described using expressions such as mean error, root mean square error, and error of mean square. Pearson’s terminology provided a more concise name for the measure of dispersion.
Why Was Sigma Used?
The lowercase Greek letter σ became associated with standard deviation through Pearson’s work. Historical notation sources identify Pearson’s 1894 publication as an early documented use of σ for standard deviation.
Over time, statistical notation became more systematic. Population quantities were increasingly distinguished from sample quantities, leading to conventions such as:
- μ → population mean
- σ → population standard deviation
- σ² → population variance
- x̄ → sample mean
- s → sample standard deviation
- s² → sample variance
These conventions are now widely encountered in statistics and scientific measurement.
Standard Deviation Symbolism and Interpretation
Unlike cultural symbols, standard deviation symbols do not normally carry religious, spiritual, or traditional cultural meanings. Their significance is technical and mathematical.
The Meaning of σ in Statistics
The symbol σ communicates information about variation.
For example:
- Small σ → values are relatively concentrated around the mean.
- Large σ → values are more dispersed around the mean.
- σ = 0 → every value in the population is identical.
The symbol does not tell you whether a dataset is “good” or “bad.” A large standard deviation can be useful or undesirable depending on what is being measured.
Positive and Negative Interpretation
Standard deviation itself cannot be negative.
A standard deviation is zero or positive because it is calculated from squared deviations and then square-rooted.
However, individual deviations from the mean can be positive or negative. For example, a value above the mean has a positive deviation, while a value below the mean has a negative deviation.
The squaring step removes the cancellation that would otherwise occur when deviations are added together.
Psychological Interpretation
Standard deviation has no universally accepted psychological symbolism. In data interpretation, however, people sometimes use it informally as an indicator of consistency, variability, or predictability.
That interpretation must remain connected to the dataset. A high standard deviation in test scores means greater variation in scores; it does not automatically mean the students or the test itself are better or worse.
Cultural Significance of Standard Deviation Symbols
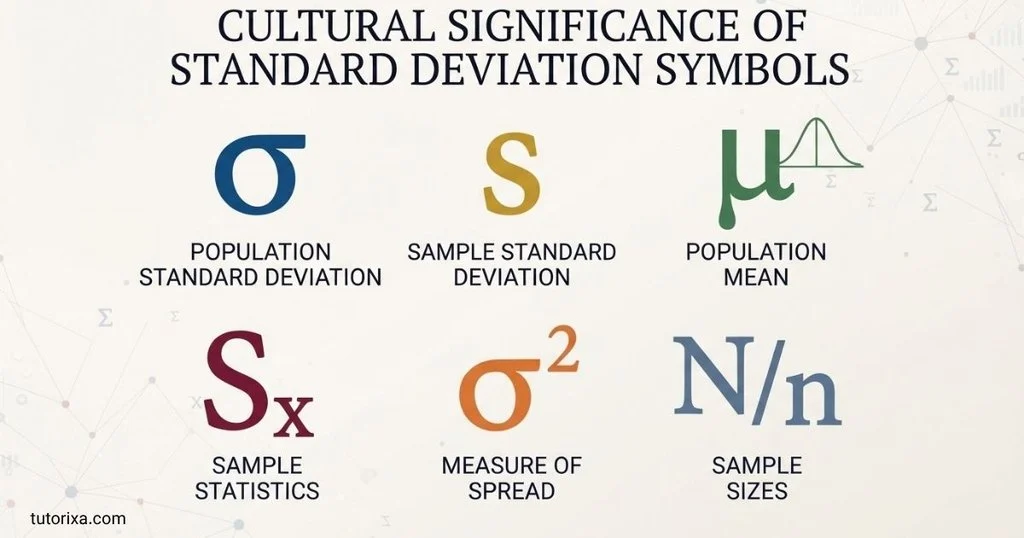
Standard deviation symbols have no major independent cultural or religious symbolism comparable to symbols such as the cross, crescent, lotus, or yin-yang.
Their importance is instead international and academic.
Mathematicians, statisticians, engineers, scientists, economists, researchers, and students in many countries use the same basic notation. This makes σ and related statistical symbols useful as a shared mathematical language.
The Greek letter itself comes from the Greek alphabet, where sigma is the letter corresponding to the “s” sound. In modern mathematics, however, its statistical meaning comes from established mathematical convention rather than from the ancient cultural meaning of the Greek letter.
NIST’s technical guidance lists sigma as part of the standardized Greek alphabet used in scientific and mathematical writing.
Scientific and Technical Meaning
Standard deviation symbols are especially important in statistics, probability, science, engineering, metrology, medicine, economics, and data analysis.
Mathematics and Statistics
In statistics, σ and s quantify variation.
A population standard deviation can be written as:
σ = √[Σ(xᵢ − μ)² / N]
A sample standard deviation is commonly written as:
s = √[Σ(xᵢ − x̄)² / (n − 1)]
Here:
- xᵢ = individual observation
- μ = population mean
- x̄ = sample mean
- N = population size
- n = sample size
- Σ = sum of the indicated values
NIST provides these population and sample distinctions in its statistical and measurement references.
Standard Deviation and Units
One important advantage of standard deviation is that it has the same units as the original measurements.
For example, if height is measured in centimeters, standard deviation is also measured in centimeters.
Variance is different: its units are squared. A variance based on centimeters would have units of square centimeters.
This is one reason standard deviation is often easier to interpret than variance in practical measurement work.
Standard Deviation in Measurement Science
Standard deviation is widely used when scientists repeat measurements and want to describe variation.
NIST’s measurement guidance identifies σ as the population standard deviation and s as an estimate calculated from data. It also distinguishes standard deviation from standard error, which is related to the uncertainty of an estimated mean.
Standard Deviation in Probability
In probability distributions, σ is often used to describe the spread of a random variable around its expected value.
For a normal distribution, the mean and standard deviation are especially important parameters:
- μ identifies the center.
- σ identifies the spread.
Changing σ changes how widely the distribution is dispersed around its mean.
Where Standard Deviation Symbols Are Used
You can encounter standard deviation symbols in many settings.
Textbooks and Class Notes
Statistics and mathematics textbooks commonly use σ, s, μ, x̄, Σ, n, and N.
Scientific Papers
Researchers use standard deviation notation when reporting measurements, experimental results, and statistical analyses.
Data Tables
A research table might report a measurement as:
Mean = 72.4, SD = 5.8
In this context, SD is an abbreviation for standard deviation, while a mathematical formula may use σ or s.
Probability Distributions
Standard deviation is commonly included when describing probability distributions.
Engineering
Engineers use standard deviation when studying measurement variation, manufacturing processes, reliability, and experimental results.
Quality Control
Statistical process control uses measures of variation to assess process behavior. NIST’s statistical materials distinguish control limits, which concern process consistency, from specification limits, which concern whether output meets requirements.
Medical and Laboratory Research
Standard deviation is frequently used to summarize variation among laboratory measurements or observations. NIST’s forensic statistics material defines population and sample standard deviation separately and identifies their corresponding notation.
Spreadsheets and Software
Statistical software may calculate standard deviation using functions such as sample- or population-specific formulas. The software’s function name can differ even though the underlying statistical concepts correspond to s and σ.
Common Variations of Standard Deviation Symbols
The basic notation is simple, but several variations appear in practice.
σ
σ is the standard population notation.
s
s is commonly used for a sample standard deviation.
σₓ
A subscript may identify the variable whose standard deviation is being described.
For example:
σₓ
can mean the standard deviation of variable x.
NIST technical material uses notation such as σx when identifying the standard deviation associated with a measured quantity.
σ̂
A hat over sigma, written σ̂, can indicate an estimate of σ in some statistical contexts.
However, notation is not completely universal. Some authors simply use s for the sample estimate of σ.
SD
In prose and research tables, SD is frequently used as an abbreviation for standard deviation.
It is not a separate mathematical quantity from standard deviation. It is simply a compact textual abbreviation.
Standard Deviation Symbols vs. Related Symbols
Several statistical symbols are easy to confuse.
| Symbol | Meaning |
| σ | Population standard deviation |
| s | Sample standard deviation |
| σ² | Population variance |
| s² | Sample variance |
| μ | Population mean |
| x̄ | Sample mean |
| Σ | Summation |
| n | Sample size |
| N | Population size |
| SE | Standard error, a different concept |
The distinction between standard deviation and standard error is especially important. Standard deviation describes variability among observations, whereas standard error is associated with the variability of an estimated statistic such as a sample mean. NIST explicitly treats standard error separately from standard deviation.
Common Misconceptions About Standard Deviation Symbols
Misconception 1: σ and s Always Mean Exactly the Same Thing
They are related, but they commonly distinguish population and sample standard deviation.
σ generally refers to the population parameter, while s commonly refers to a sample estimate.
Misconception 2: σ² Is Standard Deviation
It is not.
σ² is variance, while σ is standard deviation.
The relationship is:
σ = √σ²
Misconception 3: Standard Deviation Can Be Negative
Standard deviation cannot be negative.
A standard deviation can equal zero, but it cannot fall below zero.
Misconception 4: Sigma Always Means Standard Deviation
Not necessarily.
The Greek letter sigma has different meanings in different mathematical contexts. Most famously, Σ represents summation, while σ can represent standard deviation in statistics.
Context determines the meaning.
Misconception 5: A Large Standard Deviation Is Automatically Bad
A large standard deviation simply indicates greater spread. Whether that spread is desirable depends on the subject being studied.
Misconception 6: Standard Deviation and Standard Error Are Identical
They are different quantities with different purposes.
Standard deviation describes variation in data, while standard error describes the sampling variability of an estimated statistic.
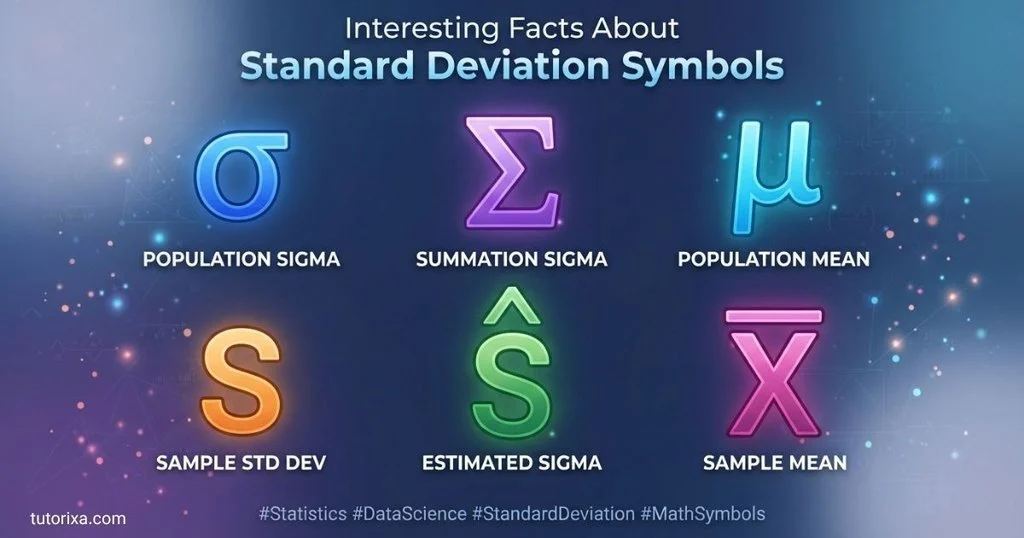
10 Interesting Facts About Standard Deviation Symbols
- σ is a Greek letter.
The lowercase sigma is borrowed from the Greek alphabet and became an established statistical notation for population standard deviation. - Karl Pearson is strongly associated with the modern notation.
Historical sources document Pearson’s use of σ for standard deviation in his 1894 work. - The term predates many modern statistical tools.
The expression “standard deviation” emerged long before calculators, spreadsheets, and statistical software became common. - s is closely connected to σ.
In modern statistical practice, s is commonly used as an estimate of the population standard deviation σ. - Variance and standard deviation are directly connected.
Variance is the square of standard deviation, which is why σ² and s² appear so frequently beside σ and s. - Standard deviation retains the original measurement unit.
If data are recorded in meters, the standard deviation is also in meters. - The capital sigma has a different job.
Σ is commonly the summation symbol, whereas σ is commonly used for population standard deviation. - The notation is internationally recognizable.
Mathematical symbols allow statistical ideas to be communicated across languages without translating every technical term. - Standard deviation is a measure of dispersion.
It describes spread around a central value rather than identifying the center itself. - The symbol’s meaning depends on context.
Sigma can represent different mathematical ideas in different fields, so readers should examine the surrounding formula before assigning a meaning.
Related Symbols
Variance Symbol: σ²
Variance is the square of the population standard deviation. It is particularly useful in statistical theory and mathematical derivations.
Sample Variance: s²
This is the squared sample standard deviation and is commonly calculated using the n − 1 denominator.
Mean Symbol: μ
The Greek letter mu commonly represents the population mean.
Sample Mean: x̄
The x-bar notation commonly represents the mean calculated from sample observations.
Summation Symbol: Σ
Capital sigma represents summation. It tells the reader to add a sequence of terms according to the limits and expression provided.
Standard Error: SE
Standard error describes the variability associated with an estimated statistic and should not be treated as another name for standard deviation.
Frequently Asked Questions
What is the main symbol for standard deviation?
The most common symbol for a population standard deviation is σ, the lowercase Greek letter sigma. For a sample standard deviation, s is commonly used. The distinction is important because σ represents a population parameter, whereas s is calculated from sample data and commonly serves as an estimate of σ.
What does σ mean in statistics?
In statistics, σ commonly means the population standard deviation. It describes the amount of variation among values in a population relative to the population mean μ. The symbol is particularly common in probability distributions, statistical formulas, scientific measurement, and theoretical statistics.
What is the difference between σ and s?
The main distinction is population versus sample. σ generally represents the standard deviation of a complete population, while s commonly represents the standard deviation calculated from a sample. The sample value is used to estimate the corresponding population quantity.
What does σ² mean?
σ² represents the population variance. It is the square of the population standard deviation. Because variance is calculated before taking the square root in the standard-deviation formula, σ² and σ naturally appear together in statistical equations. Variance and standard deviation describe dispersion but use different units.
What does s² mean?
s² commonly represents the sample variance. It is the square of the sample standard deviation, s. In the usual sample-variance formula, squared deviations from the sample mean are divided by n − 1 before taking the square root to obtain s.
Is sigma always the symbol for standard deviation?
No. Sigma does not always mean standard deviation. Lowercase σ is commonly used for population standard deviation, but mathematical notation changes according to context. Capital Σ, for example, is commonly the summation symbol. Other disciplines can also assign different meanings to σ.
Why is standard deviation represented by sigma?
The association comes from established statistical notation. Historical sources identify Karl Pearson’s 1894 publication as an early documented use of σ for standard deviation. Pearson had introduced the term “standard deviation” in lectures in 1893.
Can standard deviation be zero?
Yes. A standard deviation of zero means there is no variation in the observations: every value is identical to the mean. If even some observations differ, the standard deviation will normally be greater than zero. Standard deviation itself cannot be negative because the calculation is based on squared deviations.
What symbol represents sample standard deviation?
The most common symbol is s. Some authors and software documentation may use alternative notation, such as Sx, depending on the context. The important distinction is whether the notation represents a sample statistic or a population parameter.
What is the difference between standard deviation and standard error?
Standard deviation describes how observations vary around their mean. Standard error instead describes the sampling variability of an estimated statistic, such as a sample mean. They are related but answer different questions, so replacing one with the other can change the interpretation of statistical results.
Key Takeaways
- σ commonly represents population standard deviation.
- s commonly represents sample standard deviation.
- σ² represents population variance.
- s² represents sample variance.
- μ commonly represents population mean.
- x̄ commonly represents sample mean.
- Σ is the summation symbol, not normally the standard deviation symbol.
- Standard deviation measures the spread of observations around their mean.
- Population and sample standard deviations use different notation and formulas.
- Standard deviation has the same measurement units as the original data.
- Karl Pearson is associated with the introduction of the term “standard deviation” and the early use of σ for it.
- Standard deviation symbols are technical mathematical notation rather than religious, spiritual, or culturally symbolic signs.
Conclusion
Standard deviation symbols provide a concise language for describing variation in numerical data. The lowercase Greek σ is most commonly associated with population standard deviation, while s commonly represents sample standard deviation. Related symbols such as σ², s², μ, x̄, and Σ help distinguish variance, means, and summation within statistical formulas.
Understanding these symbols makes statistical equations much easier to read. More importantly, recognizing the difference between population parameters and sample statistics helps prevent one of the most common sources of confusion in statistics. From scientific measurement and probability to research, engineering, and data analysis, these small symbols communicate a surprisingly large amount of information.

I’m Freddie Beaumont, a British author with a passion for discovering what symbols communicate without words. I write about their history, meanings, and everyday uses in an accessible way. I believe symbols tell fascinating stories about people, cultures, and ideas, and my work helps readers recognise and understand those stories more clearly.
Books:
- Symbols and Their Hidden Meanings
- Understanding Signs and Symbols
 Rowan Whitaker
 Ellis Montgomery