
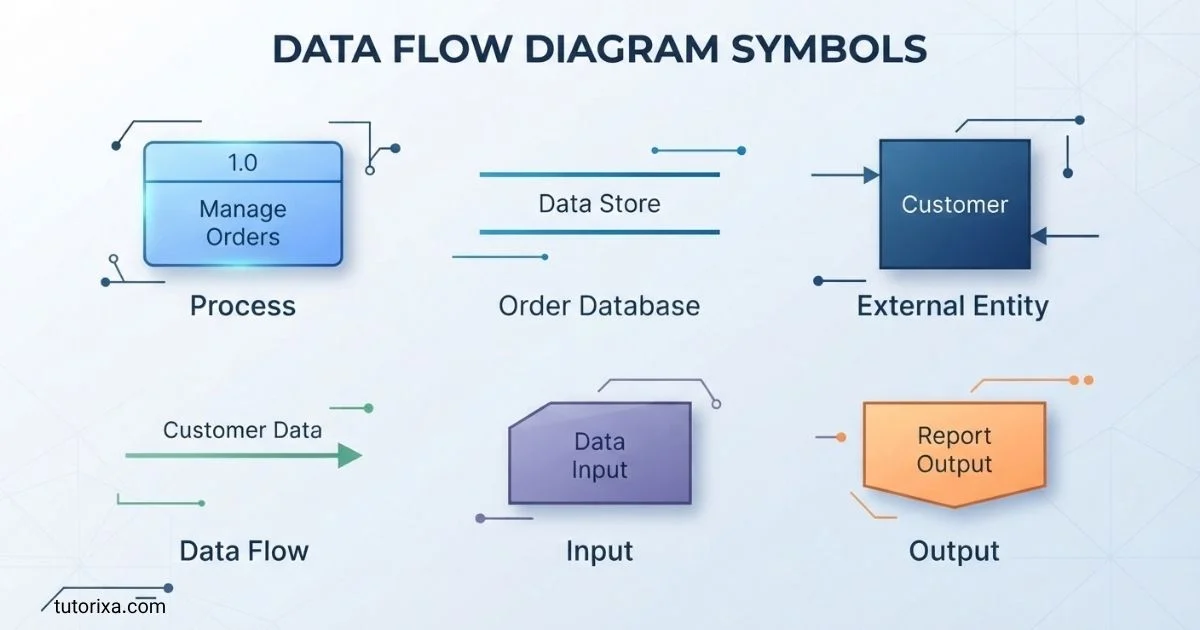
Understanding Data Flow Diagram Symbols can feel confusing when you are just starting out. I know how difficult it can be to understand different shapes, arrows, and connections without clear explanations.
The good news is that each symbol has a specific purpose, and learning what it means can make your work much easier. You can use these symbols to understand how information moves through a system, where it is processed, and where it is stored.
In this guide, I’ll help you explore the essential Data Flow Diagram Symbols, understand their meanings, and see how they work through simple examples. Whether you are a student, beginner, or professional, you’ll gain the confidence to read and create data flow diagrams more effectively.
Quick Meaning
Data flow diagram symbols are standardized visual shapes used to represent the movement and handling of information within a system. The four fundamental elements are processes, data flows, data stores, and external entities. Together, they show where data originates, how a system transforms it, where information is stored, and where outputs are delivered.
Data Flow Diagram Symbols Overview
| Symbol | Meaning | Category | Common Representation | Common Usage |
| Process | Transforms incoming data into outgoing data | Process | Circle, rounded rectangle, or bubble | Calculations, validation, processing |
| Data Flow | Shows movement of data | Flow | Arrow | Connecting processes, stores, and entities |
| Data Store | Represents stored information | Storage | Open-ended rectangle or parallel lines | Database, file, repository |
| External Entity | Represents a person, organization, or system outside the process boundary | Entity | Rectangle or square | Customer, supplier, bank, external system |
| Context/Boundary | Defines the system being modeled | System-level | Large boundary or context diagram | High-level system representation |
The exact appearance can vary between Yourdon–DeMarco, Gane–Sarson, and software diagramming tools. The underlying concepts remain largely the same.
What Do Data Flow Diagram Symbols Mean?
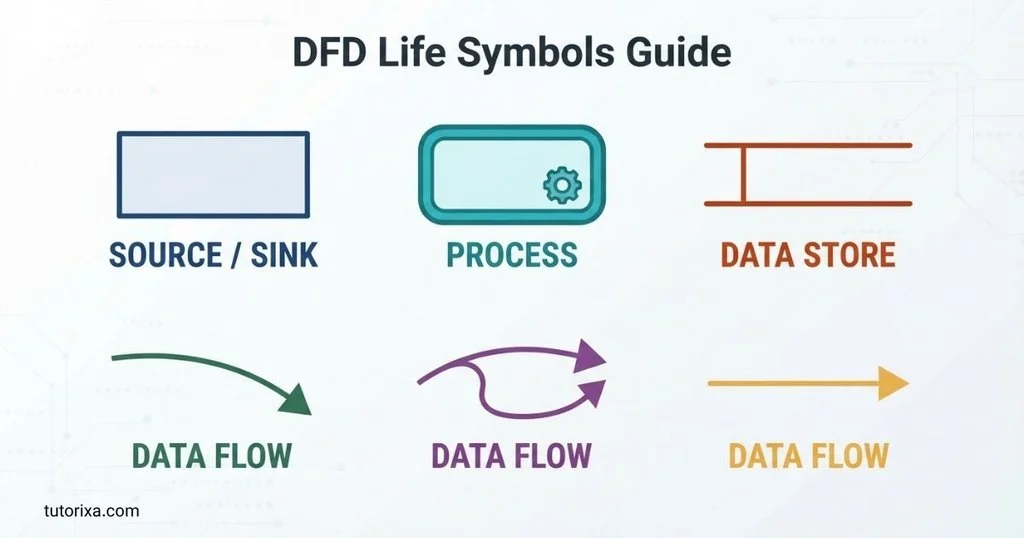
The four core DFD symbols describe four different questions:
- External entity: Who or what sends or receives data?
- Process: What happens to the data?
- Data flow: What data moves between components?
- Data store: Where is data kept?
For example, imagine an online shopping system. A Customer can be an external entity. The Place Order activity is a process. An arrow labeled Order Details represents a data flow, while an Order Database represents a data store.
The important idea is that a DFD focuses on data movement and transformation, not on physical infrastructure or program code. It normally does not show exactly which server runs a process, which programming language is used, or the precise sequence of user-interface clicks.
1. Process Symbol
A process symbol represents an activity that receives data and transforms it into another form or produces an output.
A process might:
- Calculate a total
- Validate customer information
- Approve an application
- Generate an invoice
- Check inventory
- Process a payment request
- Create a report
The process is usually labeled with a meaningful verb or verb phrase, such as Validate Order, Calculate Salary, or Generate Report.
Different DFD conventions use different shapes. Yourdon–DeMarco commonly uses a circle or bubble, while Gane–Sarson uses a rounded rectangle.
A good process should describe what the system does, rather than simply naming a person or piece of hardware.
2. Data Flow Symbol
A data flow symbol is normally an arrow that shows information moving from one DFD component to another.
The arrow direction matters. It indicates where the data is going.
Examples include:
- Customer → Order Details → Place Order
- Place Order → Order Confirmation → Customer
- Inventory Database → Stock Information → Check Inventory
The arrow should normally have a meaningful label. Saying Information is often too vague. A label such as Customer Address, Payment Details, or Employee Records gives the reader a much clearer understanding of what is moving.
A data flow represents information, not necessarily the physical movement of an object.
3. Data Store Symbol
A data store represents information retained by the system for later use.
It can represent:
- A database
- A structured file
- A customer record repository
- An inventory database
- An employee file
- A document collection
- A persistent information repository
In different DFD notations, a data store may appear as two parallel lines, an open-ended rectangle, or another specialized storage shape.
For example:
Customer → Customer Details → Register Customer → Customer Database
Here, the Customer Database is a data store because the information is retained rather than simply passing through the process.
A DFD does not necessarily specify whether the store is implemented as MySQL, PostgreSQL, MongoDB, a spreadsheet, or a physical filing system unless the diagram’s purpose requires that detail.
4. External Entity Symbol
An external entity represents something outside the system boundary that sends data to the system or receives data from it.
An external entity may be:
- A person
- A customer
- An employee
- A supplier
- A government agency
- A bank
- Another software system
- Another organizational department
For example, in an online banking DFD, Customer and External Bank Network might be external entities depending on what system boundary is being modeled.
The same organization or system can sometimes be an internal component in one DFD and an external entity in another. Its classification depends on the boundary of the system being studied.
History and Origin of Data Flow Diagrams
Data flow diagrams developed as part of the broader evolution of structured systems analysis and software engineering during the twentieth century. They became particularly influential in structured analysis approaches used to understand information systems before implementation.
Two important DFD notation families are associated with Tom DeMarco and Chris Gane and Trish Sarson. DeMarco’s structured analysis work helped popularize a notation using circles for processes, arrows for data flows, data stores, and external entities. Gane and Sarson developed another widely recognized notation with different visual conventions.
DFDs became valuable because analysts needed a way to describe complex information systems without immediately getting lost in programming details.
Unlike a flowchart, which often emphasizes control or procedural sequence, a DFD concentrates on how data enters, moves through, changes within, and leaves a system.
Over time, diagramming software made DFD creation easier, but the fundamental concepts remained useful in requirements analysis, business process documentation, database planning, and system design.
Symbolism and Interpretation of DFD Symbols
Unlike religious or cultural symbols, DFD symbols do not normally carry traditional spiritual or psychological meanings. Their meaning is technical and representational.
The shapes act as a visual language.
A process indicates transformation.
An arrow indicates movement.
A data store indicates retention.
An external entity indicates interaction across a system boundary.
This makes DFD notation useful because the reader does not have to interpret the diagram artistically. The meaning comes from established modeling conventions and labels.
Positive Characteristics of DFD Symbols
Well-designed symbols can make a system:
- Easier to understand
- Easier to document
- Easier to discuss with stakeholders
- Easier to analyze for missing data
- Easier to break into smaller processes
- Easier to maintain as requirements change
What DFD Symbols Do Not Mean
A DFD arrow does not automatically mean chronological execution.
Likewise, a process circle does not necessarily represent a single software function. It may represent a larger business activity.
This distinction is important because readers sometimes mistake a DFD for a flowchart or program flow diagram.
Cultural and Regional Significance
Data flow diagram symbols do not have major cultural or religious meanings in the way that ancient symbols, flags, or sacred signs do. Their significance is primarily associated with the history of information systems, computing, business analysis, and systems engineering.
However, notation preferences can vary between organizations, textbooks, countries, and software tools.
For example, one organization may use Yourdon–DeMarco notation, while another may prefer Gane–Sarson notation. Both can communicate essentially the same conceptual model even though their shapes look different.
The important point is to identify the notation being used and apply it consistently.
Scientific or Technical Meaning
DFD symbols are fundamentally technical modeling elements.
They are especially relevant to:
- Software engineering
- Systems analysis
- Information systems
- Database planning
- Business analysis
- Requirements engineering
- Process documentation
- Enterprise architecture
- Data management
A DFD can help analysts examine whether information has a logical path through a system.
For example, if a process receives Customer Order data but has no output, the model may need review. Similarly, if a process produces Invoice information but there is no destination for it, the analyst may have discovered an incomplete model.
DFDs are therefore useful not only for documentation but also for finding inconsistencies in system requirements.
Where Data Flow Diagram Symbols Are Used
Software Development
Developers and analysts can use DFDs to understand information requirements before implementation.
Business Analysis
Businesses can model activities such as order processing, employee management, purchasing, billing, and customer support.
Database Design
DFDs can help identify the information a system needs to store and the processes that interact with it.
Education
Students studying computer science, information technology, and systems analysis often learn DFD notation as part of systems modeling.
Documentation
Organizations can use diagrams to explain legacy systems to employees, analysts, developers, or auditors.
Requirements Gathering
A DFD can provide a shared visual language between technical teams and nontechnical stakeholders.
Common DFD Levels
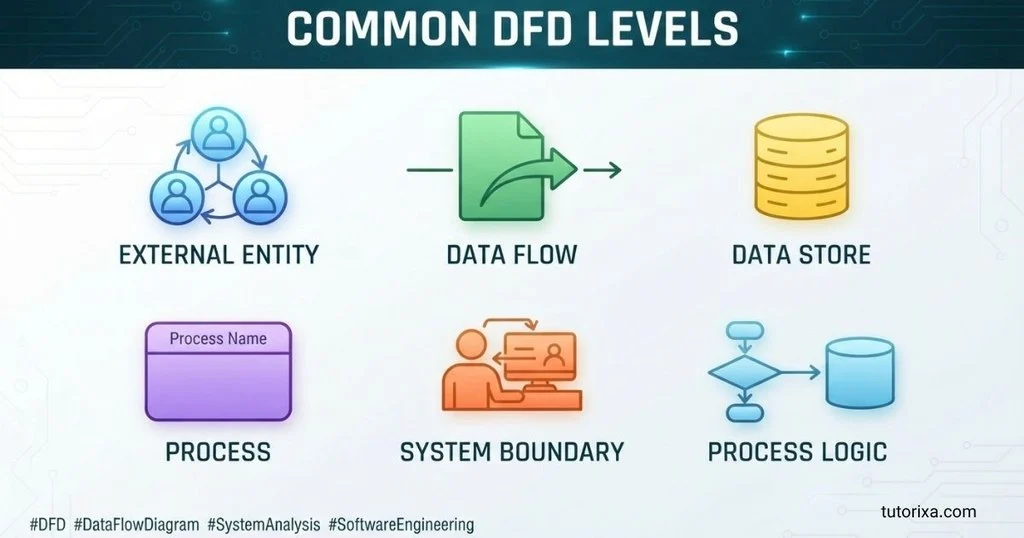
Data flow diagrams are commonly organized into levels so that a complicated system can be explained gradually.
Context Diagram
A context diagram provides the highest-level view. It treats the entire system as one process and shows its major interactions with external entities.
For example:
Customer → Online Shopping System → Customer
The diagram might show Order Details entering the system and Order Confirmation leaving it.
Level 0 DFD
A Level 0 DFD breaks the overall system into its major processes.
An online store might contain processes such as:
- Manage Customer
- Process Order
- Check Inventory
- Process Payment
- Generate Shipment
Level 1 and Lower-Level DFDs
A Level 1 diagram can expand one of the Level 0 processes into smaller processes.
For example, Process Order might become:
- Receive Order
- Validate Order
- Check Stock
- Calculate Total
- Confirm Order
Further levels can provide additional detail when necessary.
The goal is not to create as many levels as possible. The goal is to provide enough detail for the intended audience.
Common Variations in DFD Symbols
There is no single visual shape used universally for every DFD.
Yourdon–DeMarco Notation
This notation commonly represents:
- Processes with circles or bubbles
- Data flows with arrows
- Data stores with parallel lines or open-ended notation
- External entities with rectangles
Gane–Sarson Notation
Gane–Sarson commonly uses:
- Rounded rectangles for processes
- Arrows for data flows
- Open-ended rectangles for data stores
- Rectangles for external entities
The visual differences do not necessarily represent differences in the underlying concepts.
Modern Diagramming Tools
Applications such as diagram editors may offer customized DFD templates. These can introduce slight variations in shape, color, borders, or typography.
Consistency is more important than decoration.
Common Misconceptions
DFDs Are the Same as Flowcharts
They are not identical. Flowcharts often emphasize procedural or control flow, while DFDs focus specifically on the movement and transformation of data.
Every Arrow Shows Time Sequence
Not necessarily. An arrow primarily shows a data relationship or movement between components. It should not automatically be interpreted as a detailed execution timeline.
A Data Store Must Be a Database
No. A data store represents retained information. It can conceptually represent a database, file, record collection, or another persistent repository.
External Entities Must Be People
No. An external entity can be another organization, department, system, device, or service outside the defined system boundary.
Every Process Must Have Only One Input and One Output
No. A process can have multiple inputs and outputs, provided the data relationships make logical sense.
DFD Symbols Have One Universal Shape
No. Different established notations use different visual representations. The concepts are more important than the exact shape.
10 Interesting Facts About Data Flow Diagram Symbols
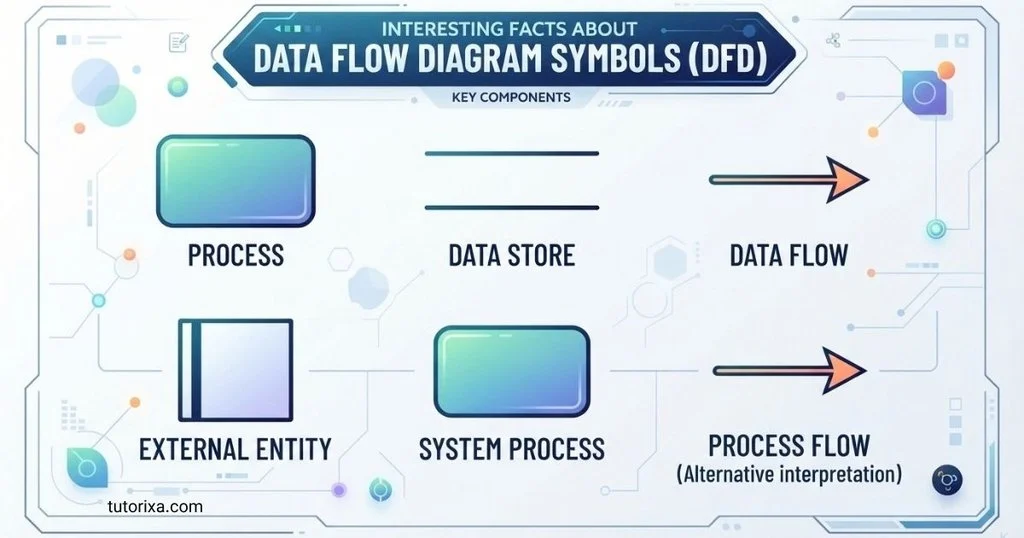
- DFDs focus on data rather than program code.
They can describe what information a system handles without specifying programming languages or implementation details. - The system boundary changes what counts as external.
A bank may be external in one model but internal to a larger banking-system model. - Arrows are semantically important.
Reversing an arrow can change the meaning because direction indicates where information is being transferred. - DFDs can be hierarchical.
A large process can be decomposed into smaller processes, allowing readers to move from a high-level view to greater detail. - Yourdon–DeMarco and Gane–Sarson look different.
Their visual differences demonstrate that diagram notation can vary while retaining the same fundamental modeling concepts. - A DFD does not need to represent physical infrastructure.
Servers, cables, and processors are generally outside the central purpose of a logical DFD. - Data stores show persistence.
Their presence tells readers that information is retained for later access rather than simply transferred between components. - DFDs can reveal missing requirements.
An unexplained input, output, or data relationship can prompt useful questions during system analysis. - Context diagrams simplify complex systems.
They allow stakeholders to see the system’s major external interactions without immediately examining internal processes. - Labels matter as much as shapes.
A technically correct shape with a vague label can still create confusion. Precise names improve readability and interpretation.
Related Symbols and Diagram Types
Several other diagramming approaches are closely related to DFDs but serve different purposes.
Flowchart Symbols
Flowcharts commonly use rectangles for processes, diamonds for decisions, and arrows for flow. They are often more focused on procedural logic.
UML Activity Diagram Symbols
UML activity diagrams model workflows and activities and can represent decisions, parallel behavior, and control flow.
UML Sequence Diagrams
Sequence diagrams show interactions between participants over time. They are useful when the order of messages is important.
Entity-Relationship Diagram Symbols
ER diagrams focus on entities, attributes, and relationships, particularly for modeling data structures and databases.
Data Modeling Symbols
Data models describe how data elements relate to one another. They complement DFDs because a DFD explains data movement while a data model explains data structure.
Frequently Asked Questions
What are the four basic symbols in a data flow diagram?
The four fundamental DFD elements are process, data flow, data store, and external entity. A process transforms data, a data flow shows information moving between components, a data store represents retained information, and an external entity represents something outside the modeled system that sends or receives data.
What does an arrow mean in a data flow diagram?
An arrow represents a data flow. It identifies information moving from one component to another and indicates its direction. The arrow should normally have a descriptive label, such as Customer Details, Payment Information, Order Data, or Invoice. An arrow does not necessarily indicate a detailed chronological sequence of program execution.
What shape represents a process in a DFD?
The process shape depends on the notation. In Yourdon–DeMarco, a process is commonly shown as a circle or bubble. In Gane–Sarson, it is commonly represented by a rounded rectangle. Both represent an activity that transforms incoming data into outgoing data.
What does a data store represent?
A data store represents information that the system retains for future use. It can conceptually represent a database, file, repository, or collection of records. The symbol describes the logical storage of information rather than requiring a particular physical technology such as SQL, NoSQL, or cloud storage.
What is an external entity in a DFD?
An external entity is a person, organization, department, device, or system outside the boundary of the system being modeled. It interacts with the system by providing or receiving data. Common examples include customers, suppliers, banks, government agencies, and external software systems.
Are DFD symbols standardized?
DFD concepts are well established, but visual notation is not completely uniform. Yourdon–DeMarco and Gane–Sarson are two well-known notation styles with different shapes. Organizations and software tools may also make minor visual changes. Therefore, readers should consider the notation and legend used by the particular diagram.
What is the difference between a DFD and a flowchart?
A DFD primarily explains how data moves through a system and how processes transform it. A flowchart generally focuses more on procedural steps, decisions, and control flow. A flowchart might show what happens next in a process, whereas a DFD emphasizes what information enters, leaves, moves through, or is stored by the system.
Can a DFD show databases?
Yes. A database can be represented conceptually as a data store in a DFD. The data store identifies information retained by the system. A DFD generally does not need to show the database’s specific tables, columns, indexes, or physical architecture unless the diagram is being combined with more detailed technical documentation.
What is a context diagram?
A context diagram is a high-level representation of a system. It generally treats the entire system as a single process and shows the major external entities and data flows interacting with it. It provides a simple overview before the system is decomposed into more detailed DFD levels.
Why are DFD symbols useful?
DFD symbols provide a concise visual language for analyzing information systems. They help people identify data sources, transformations, storage locations, and destinations. This can make requirements easier to discuss and can expose missing, duplicated, or unclear data relationships before a system is implemented.
Key Takeaways
- Data flow diagram symbols visually represent how information moves through a system.
- The four fundamental elements are processes, data flows, data stores, and external entities.
- A process transforms incoming information into useful outputs.
- A data-flow arrow shows the direction of information movement.
- A data store represents retained information.
- An external entity exists outside the defined system boundary.
- Yourdon–DeMarco and Gane–Sarson use different visual styles.
- DFDs focus on data relationships rather than detailed program execution.
- Context diagrams provide a high-level view of a system.
- Lower-level diagrams can decompose complex processes into smaller activities.
- DFDs are useful in software engineering, business analysis, database planning, and requirements documentation.
- Labels should clearly describe the information or activity represented by each symbol.
Conclusion
Data flow diagram symbols provide a simple but powerful visual language for understanding information systems. The core concepts—process, data flow, data store, and external entity—show how information enters a system, gets transformed, moves between components, and is retained for future use.
Their history is rooted in structured systems analysis, but their practical value remains relevant wherever people need to understand complex information movement. Whether you are studying computer science, documenting a business process, analyzing software requirements, or planning a new information system, learning these symbols gives you a reliable foundation for reading and creating clear DFDs.
The most important thing is not memorizing the appearance of every shape. It is understanding the relationship between data, processes, storage, and system boundaries. Once those relationships are clear, even a complicated data flow diagram becomes much easier to interpret.

I’m Freddie Beaumont, a British author with a passion for discovering what symbols communicate without words. I write about their history, meanings, and everyday uses in an accessible way. I believe symbols tell fascinating stories about people, cultures, and ideas, and my work helps readers recognise and understand those stories more clearly.
Books:
- Symbols and Their Hidden Meanings
- Understanding Signs and Symbols
 Ellis Montgomery
 Rowan Whitaker